In the download dialog if you choose to download data to the system's
database, after the download, the Database Graph Explorer will show. Or you can
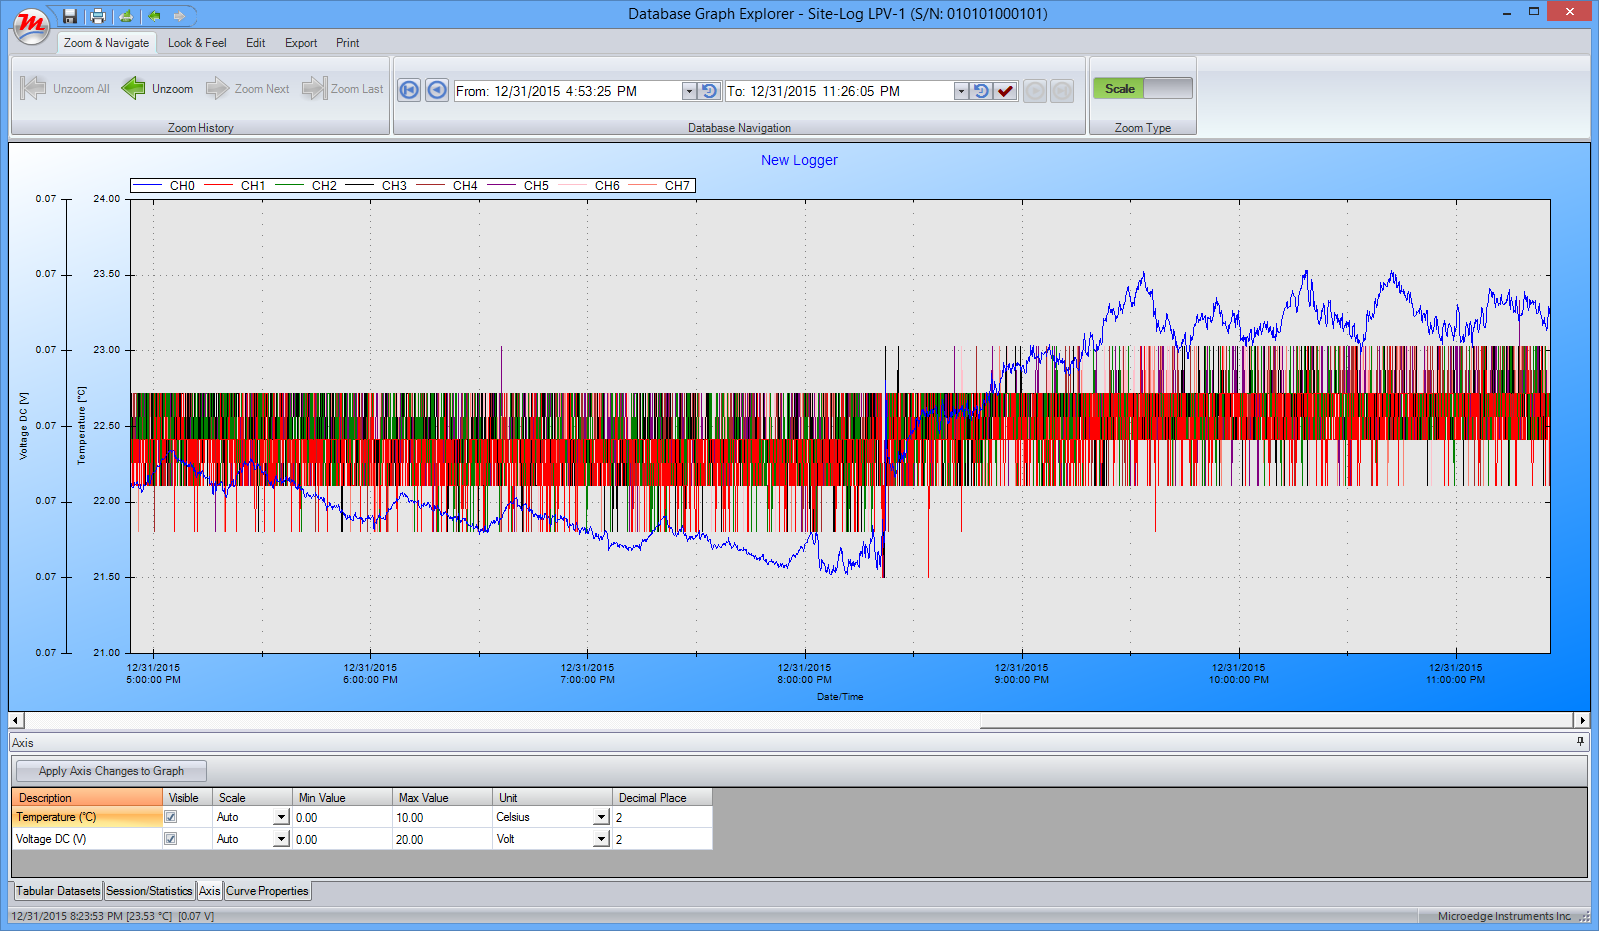
open it by Database Explorer. Here is the main interface of Database Graph Explorer: The interface contains a graph area, a ribbon control and a dockable pane
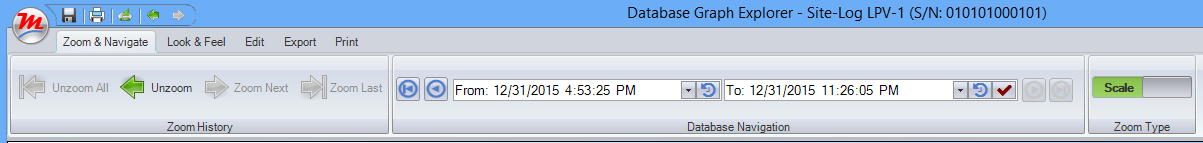
providing detailed information about the graph and the logging session. Zoom and Navigate:
With Zoom History, you can zoom out and unzoom through the graph. In Database Navigation section, you can browse the graph to any specific time
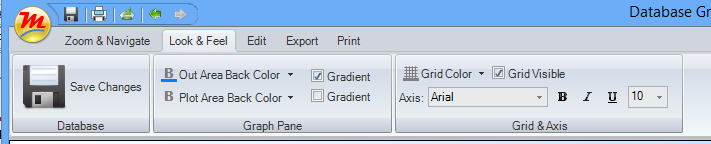
frame. And you can select for Scale Zooming or Box Zooming. Look and Feel:
You can change the look and feel of the graph from the controls in this
area. Edit:
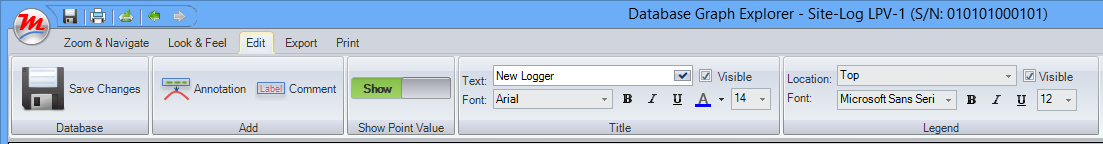
You can add annotations and comments to the graph. You can also let system
show the data point's value when the mouse is hovering on the data point. Title section allows you to change the text of the title. Legend section
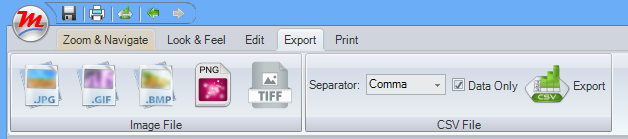
allows you to change the location and font of the legend. Export:
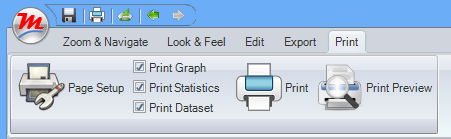
You can export the graph to image files or CSV file. Print:
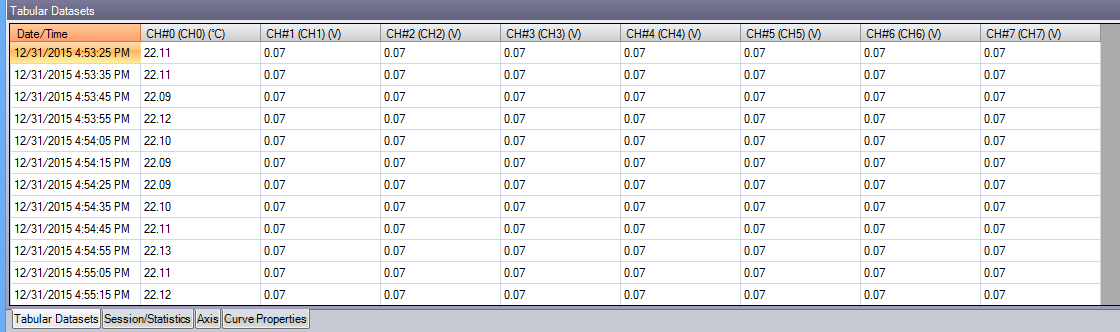
this area specifies how you want to print the graph. Tabular Datasets:
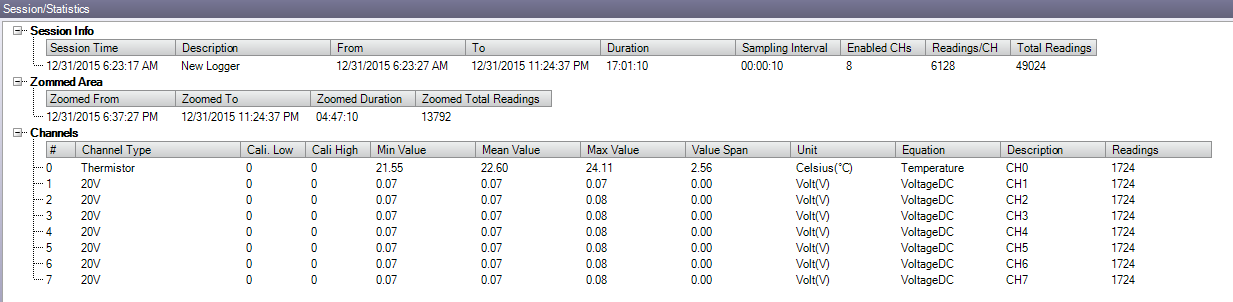
Tabular Datasets shows the datasets of the selected logging session. Session/Statistics:
This section shows the statistics and detailed information about the
logging session.